Introduction to Applied Statistical Signal Analysis: Guide to Biomedical and Electrical Engineering Applications, Third Edition

4.5: Density Function Estimation

4.5 Density Function Estimation

4.5.1 General Principle for ? 2 Approach

There are situations when knowing the statistical parameters of the data is not sufficient, and it is desired to discover or model its probability distribution. In quality control, for example, as in Example 4.1, does an exponential pdf portray the distribution of failure times accurately, or is another model necessary? This hypothesis can be tested using Pearson's ? 2 statistic (Fisz, 1980; Otnes and Enochson, 1972). Let F( x) be the hypothesized cdf for the data. Divide the range of x into N b disjoint intervals, S j, such that

(4.44)

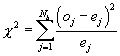
are the theoretical probabilities of occurrence. The test depends on comparing the observed number of occurrences of values in a set of samples to the number expected from the proposed distribution. Let o j and e j represent the number of observed and expected occurrences, respectively, in S j. If N equals the total number of data points, e j = N P[ S j]. The metric for this comparison, the chi-square statistic, is

(4.45)

where

(4.46)

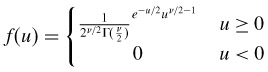
The e j are calculated from the proposed model. The chi-square statistic in equation 4.45 has been developed upon the hypothesis that the sample has the proposed cdf and the density function for ? 2 is

(4.47)

where u = ? 2 and v = the degrees of freedom = N

UNLIMITED FREE
ACCESS
TO THE WORLD'S BEST IDEAS

SUBMIT
Already a GlobalSpec user? Log in.

This is embarrasing...

An error occurred while processing the form. Please try again in a few minutes.

Customize Your GlobalSpec Experience

Category: Logic Counters
Finish!
Privacy Policy

This is embarrasing...

An error occurred while processing the form. Please try again in a few minutes.