Introduction to Applied Statistical Signal Analysis: Guide to Biomedical and Electrical Engineering Applications, Third Edition
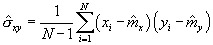
It is common to need to assess the dependence between two variables or the strength of some cause and effect relationship using the correlation coefficient. The correlation measure is used to compare the rainfall patterns in cities, the similarity between electrocardiographic waveforms, and incidence of diseases with pollution, and so forth. The estimator for the correlation coefficient, ?, is a direct translation of the theoretical definition given in Section 4.3.2. The sample covariance is
| (4.56) | |
Using the estimators for the sample variance, the sample correlation coefficient is defined as
| (4.57) | |
If both variables, x and y, have normal distributions, this estimator is also a maximum likelihood estimator. Maximum likelihood estimation will be explained in a subsequent section in this chapter. The sample correlation is calculated to find the strength of a relationship, so it is necessary to test it with some hypotheses. The sampling distribution of
is quite asymmetric and a transformation that creates an approximately normal random variable,
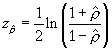
, is implemented. The transformation is
| (4.58) | |
The mean and variance of this transformation are, respectively (Fisz, 1980),
| (4.59) | |
where ? is the population correlation coefficient. When N is not small, the second term for m z can be ignored.
For hospital patients suffering circulatory shock, it is desired to know (a) if there is a correlation between the blood pH in the venous system, x, and the arterial system, y,