Basic Math for Process Control
A practical tutorial on the mathematics essential to the process control field, this book is a handy reference for process control engineers and a helpful aid to students in mathematics courses.
Sometimes the purpose of determining the most representative value is to estimate what that value will be at some future time. Preparing a budget is a prime example of this task. For example, suppose that a car owner has the following data for what he has spent on gasoline over the last five years.
| Years Ago | $ Spent for Gasoline |
|---|---|
| 5 | 850 |
| 4 | 680 |
| 3 | 810 |
| 2 | 1070 |
| 1 | 1060 |
Based on these numbers, how much should be budgeted for gasoline this year?
From the appearance of the numbers, the best and easiest way out of the dilemma would be to determine the weighted average, which turns out to be $950. However, to get some idea of any trend that may be developing, it is necessary to plot the values on a time base, as in Figure 11-1. In this graph, the negative signs indicate years in the past.
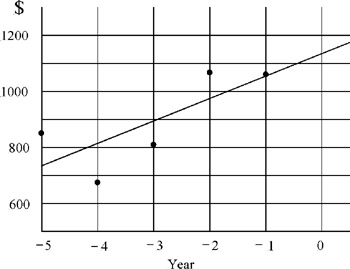
Unfortunately, the way the points are dispersed makes it difficult to eyeball in the best straight line, but help is on the way by virtue of a mathematical procedure that involves the use of calculus, but which we need not go into here. The equation of the best line will have the form y = a + bx. The procedure assumes that as far as the various points are concerned, the x values are correct (no error), but the y...