Mechanical Engineering Problems and Solutions, 6th Edition
With this guide, you'll hone your problem-solving skills as well as your understanding of both fundamental and more difficult topics for the Professional Engineering exam.
 TABLE OF CONTENTS
 A cash flow table shows the "money consequences" of a situation and its timing. For example, a simple problem might be to list the year-by-year consequences of purchasing and owning a used car:
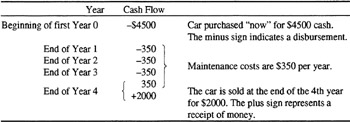
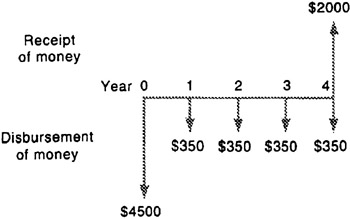
This same cash flow may be represented graphically, as shown in Fig. A.1. The upwar arrow represents a receipt of money, and the downward arrows represent disbursements. The horizontal axis represents the passage of time.
In January, 1993 a firm purchased a used typewriter for $500. Repairs cost nothing in 1993 or 1994. Repairs are $85 in 1995, $130 in 1996, and $140 in 1997. The machine is sold in 1997 for $300. Compute the cash flow table.
Solution
Unless otherwise stated, the customary assumption is a beginning-of-year purchase, followed by end-of-year receipts or disbursement, and an end-of-year resale or salvage value. Thus the typewriter repairs and the typewriter sale are assumed to occur at the end of the year. Letting a minus sign represent a disbursement of money, and a plus sign a receipt of money, we are able to set up the cash flow table:
| Year | Cash Flow |
|---|---|
| Beginning of 1993 | ?$500 |
| End of 1993 | 0 |
| End of 1994 | 0 |
| End of 1995 | ?85 |
| End of 1996 | ?130 |
| End of 1997 | +160 |
Notice that at the end of 1997 the cash flow table shows +160 which is the net sum of ?140 and +300. If we define Year 0 as the beginning of 1993, the...