Survivability and Traffic Grooming in WDM Optical Networks

Providing detailed coverage of key issues in modern optical networks, this highly useful book provides a framework for dealing with survivability and traffic grooming in wide-area networks.
In order to evaluate the accuracy of the proposed analytical framework, a set of different network topologies as listed below are used. These topologies are evaluated using a simulation setup described in Section 16.1 and the performances of analytical and simulation models are compared.
Unidirectional ring network with N nodes ( N odd)
| (16.1) | 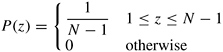 |
| (16.2) | |
Bidirectional ring network with N nodes ( N odd)
| (16.3) | 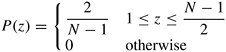 |
| (16.4) | |
Bidirectional M M mesh-torus network ( M odd)
| (16.5) | 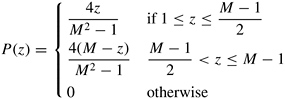 |
| (16.6) | |
Unidirectional R C mesh-torus network
| (16.7) | 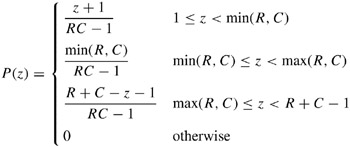 |
| (16.8) | |
The above selection of networks represents a variety of average lengths for the shortest path between node-pairs, and hence various link load correlations. Ring networks have longer path lengths and hence have a higher link load correlation. A mesh-torus has the same number of nodes as a ring network, but has a smaller average shortest path length due to the increased connectivity. Hence the mesh-torus has low values of correlation. Table 16.1 lists the specific incarnations of the network topologies and their respective average shortest path length and link load correlation.
| Network | Average shortest path length | Correlation |
|---|---|---|
| 25-node bidirectional ring | 6.5 | 0.8462 |
| 25-node unidirectional ring | 12.5 | 0.92 |
| 11-node unidirectional ring | 5.5 | 0.8182 |
| 5 5 bidirectional mesh-torus | 2.5 | 0.2 |
| 7 7 bidirectional mesh-torus |