Molecular and Particle Modelling of Laminar and Turbulent Flows
6.5. Turbulence

6.5. Turbulence

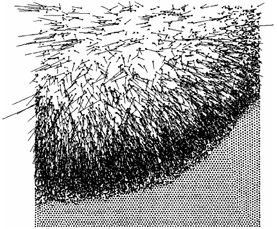
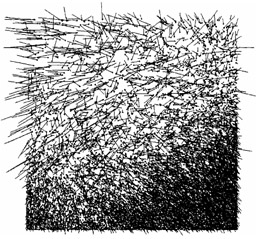
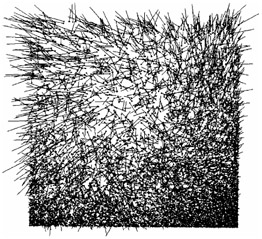
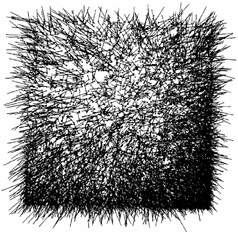
To simulate turbulence, set V = -3000, ? t = 1.0(10) -6, J = 40000, Figs. 6.11 6.13 show the flow development at the respective times 0.04, 0.08, 0.12. At t = 0.12, the time step had to be decreased to 5.0(10) -7 to avoid instability. Figure 6.14 shows the turbulent flow at t = 0.15 with J = 60000, to make up for the decrease in time step. Entirely similar results for Figs. 6.11 6.13 followed with J = 30000, 20000, 10000, while results entirely similar to that in Fig. 6.14 followed for J = 80000, 70000, and 50000. In all the figures, the velocity vectors were decreased by vm = 0.003 for graphical clarity. Figure 6.12 compares most favorably with Fig. 2.14 while Fig. 6.14 compares most favorably with Fig. 2.16.


Figure 6.11: V = -3000, J = 40000, t = 0.04.

Figure 6.12: V = -3000, J = 40000, t = 0.08.

Figure 6.13: V = -3000, J = 40000, t = 0.12.

Figure 6.14: V = -3000, J = 60000, t = 0.15.

In searching for small vortices, attention was confined to within a circle of radius 1 cm around each particle. There resulted at t = 0.12 355 small vortices which are shown in Fig. 6.15. Moreover, Fig. 6.16 shows the distribution of 349 small vortices at the time t

UNLIMITED FREE
ACCESS
TO THE WORLD'S BEST IDEAS

SUBMIT
Already a GlobalSpec user? Log in.

This is embarrasing...

An error occurred while processing the form. Please try again in a few minutes.

Customize Your GlobalSpec Experience

Category: Thermocouple Elements
Finish!
Privacy Policy

This is embarrasing...

An error occurred while processing the form. Please try again in a few minutes.