Excel 2007 for Scientists and Engineers

With examples from the world of science and engineering, this reference shows scientists the tips and techniques of Excel and how to tailor them specifically to their experiments, designs, and research.
Regression analysis is the process of making predictions of some variable, based on the relationship between this dependent variable and an independent variable (or set of variables). It is a scientist's task to find a model or an equation to make such predictions possible.
Single linear regression assumes a linear relationship between two factors: a dependent factor (y) and an independent factor (x). By using the linear equation y=a 1x+a 0, you can derive, estimate, determine, or predict the dependent factor (y) from the independent factor (x).
Figure 4.1 explains a bit of the terminology used in connection with linear regression. Let's assume that there is a linear relationship between hemoglobin percentage and the erythrocyte count in human blood. You determine what the independent factor is and plot that variable on the x axis. The linear equation y=a 1x+a 0 uses a slope (a 1) and an intercept (a 0). Thanks to this model, you can predict, determine, or estimate y based on x.
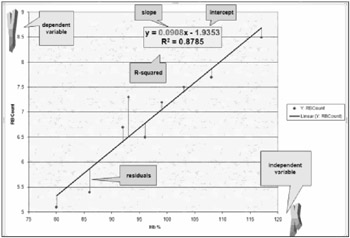
The actual, observed values are usually clustered around the linear regression line. RSQ or R 2 is a "measure...