Excel 2007 for Scientists and Engineers

With examples from the world of science and engineering, this reference shows scientists the tips and techniques of Excel and how to tailor them specifically to their experiments, designs, and research.
It is possible to simulate the types of distributions discussed in Chapter 46 and then show them on an Excel spreadsheet. You might want to do so, for example, to study their characteristics or to compare an empirical distribution with an ideal one. You can make simulations from the option Data Analysis on the Data tab. If that option is not available, you must install the Analysis Toolpak first as an add-in (see Chapter 35). Through the Data Analysis option, you can activate the option Random Number Generation.
Figure 5.18 shows the simulation of a normal distribution; it is characterized by a specific mean and a specific standard deviation. The settings for this graph are specified in cell A1. If you leave the option Random Seed empty, Excel uses its own preset seeds. Otherwise, you need to enter an optional value from which to generate random numbers. You can reuse this value later to produce the same set of random numbers. Then, when you tell it to, Excel generates these 100 random numbers. When you calculate their frequencies in column D, you get a simulated normal distribution.
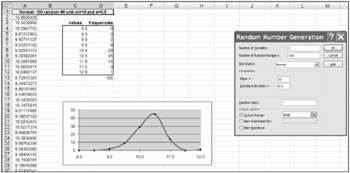
Figure 5.19 simulates a situation in which certain values occur with specific probabilities (for example, multiple alleles of a gene, with each one having its own frequency in the population). This is a discrete distribution. It is characterized by a value and the associated probability. First you need to make a table of values and their probabilities. The table must...