Excel 2007 for Scientists and Engineers

With examples from the world of science and engineering, this reference shows scientists the tips and techniques of Excel and how to tailor them specifically to their experiments, designs, and research.
 TABLE OF CONTENTS
 The normal distribution is only one of the several types of sampling distributions used in statistics. This chapter discusses the key distributions, their characteristics, and when to use each one. Distributions are sampling distributions that are meant to help evaluate sample distributions.
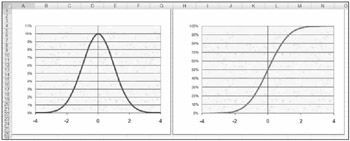
The normal distribution has two versions, as Figure 5.6 demonstrates: the noncumulative version (to the left) and the cumulative version (to the right). The cumulative graph shows that the area to the left of 0 in the noncumulative graph covers 50% of all cases. It also shows that a mean being +2 SE units away from the mean of means covers up to 97.5% of all cases. As mentioned earlier, the x axis features units of SE. These are "universal" units that can be applied to means of any magnitude (pH, oC, ng/ml, mol, volts, and so on). In case of a normal distribution, these units are called z-values. They can be positive or negative because the normal distribution is symmetrical.
But there are additional types of distributions. For example, Figure 5.7 shows the t-distribution, the chi-distribution, the binomial distribution, and the F-distribution. There are a few more distributions, but these are the ones discussed in this part of the book. The four curves shown in Figure 5.7 are all nonsymmetrical, so the x axis has only positive units (unlike the normal bell-shaped curve), and they happen to be of the cumulative type, so the vertical axis has a scale up to...