Excel 2007 for Scientists and Engineers

With examples from the world of science and engineering, this reference shows scientists the tips and techniques of Excel and how to tailor them specifically to their experiments, designs, and research.
Because scientists usually work with samples taken from huge populations, they need to deal with the fact that samples are never exact replicas of the population they represent. In order to assess how much this fact may impact results, you need statistics. This chapter doesn't provide a crash course on statistics, but you'll learn the basics of how to use Excel in your statistical work.
Figure 5.1 illustrates what happens in sampling. Let's pretend you want to study the "infinite population" of random numbers between 0 and 10 by taking 20 different samples with size 10. Each row represents one of those 20 samples. You calculate for each sample the mean of all 10 random numbers drawn from this population. Notice that those means may vary quite a bit; the extreme low and high ones are displayed in a different font. What you try to simulate here is drawing new samples from the same population and yet the mean found in the sample keeps changing. That's what happens in research! As they say, "Results may vary." However, there is one value that doesn't change as widely: the mean of all these 20 means, featured in cell L22.
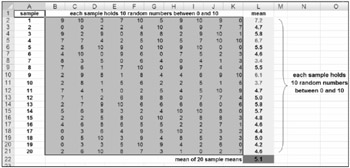
Whereas the individual means may reach 3 or 7 rather easily, it is unlikely that the mean of means ends up outside the range of 4.5 to 5.5. A sample's mean is often symbolized as x, x m, or m. The mean of means is often symbolized as ? m.