Excel 2007 for Scientists and Engineers

With examples from the world of science and engineering, this reference shows scientists the tips and techniques of Excel and how to tailor them specifically to their experiments, designs, and research.
When finding a specific proportion in a sample, you realize now that you should expect a wider range when taking other samples from the same population. Although those proportions don't completely follow a normal distribution pattern, they come close.
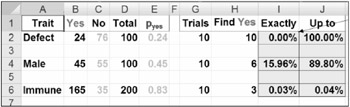
Before going into confidence limits and intervals for proportions, you should review the basics of proportions by using Figure 5.33. BINOMDIST has the following syntax: BINOMDIST(Yes,Trials,pYes,F/T). Here's what it means
If you find 24 defects ( Yes) in a sample of 100 items, the proportion of "yes," or "success," is 0.24, or 24% (cell E2).
If you take 10 trials from this batch (with 24% defects), what is the chance of finding 10 defects? BINOMDIST tells the following:
The chance of finding exactly 10 defects is almost 0%: =BINOMDIST($H2,$G2,$E2,0)
The chance of finding up to 10 defects is 100% - cumulative: =BINOMDIST($H2,$G2,$E2,1)
You can do something similar for the other cases.
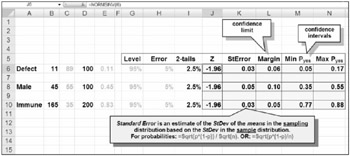
Now you are ready to get back to estimating 95% confidence intervals in Figure 5.34. Be aware that SE is calculated differently for binomial distributions: =SQRT(p*(1-p)/n). Here's how you estimate the 95% confidence intervals:
Determine z for a 2.5% two-tailed error margin in cell J6: =NORMSINV(I6).
Determine the standard error in cell K6: =SQRT(E6*(1-E6)/D6).
Determine the margin of error, z*SE, using =ABS(J6*K6).
Determine the confidence limits and confidence intervals like you did before.
In the last case scenario (row 10), you have 95% confidence of finding between...