Excel 2007 for Scientists and Engineers

With examples from the world of science and engineering, this reference shows scientists the tips and techniques of Excel and how to tailor them specifically to their experiments, designs, and research.
The validity of research depends on good samples. Good samples must have the proper size in order to be representative. In addition, good samples need items that had an equal chance to be chosen. In biased samples, some items are more likely to be chosen than others and that's not good research. Unfortunately, the mind's eye is not a good guide in selecting items for a sample. You need the unbiased verdict of a mathematical tool.
Scientists have available many sampling tools. The simplest one is the RAND function, as illustrated in Figure 5.23. Here's how you use it:
In column A, apply the function RAND.
Change the formula results into values: Copy and paste values.
Sort the values by random number.
Select the first n items for your sample. (Later in this chapter, we'll discuss what the magnitude of n should be.)
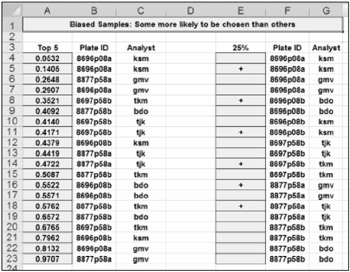
If you want a certain percentage of cases (see cell E3), and you want even this percentage to be randomly fluctuating, you can use RAND again but this time nest it inside an IF function, as is done in cell E4: =IF(RAND()<$E$3,"+",""). Each time you press F9, you get a different selection of cases of varying sizes.
The Analysis Toolpak also has a simple sampling tool, as Figure 5.24 demonstrates. An ideal sampling technique puts a chosen item back into the population so it can be chosen again. The Analysis Toolpak uses this technique in spite of that...