Excel 2007 for Scientists and Engineers

With examples from the world of science and engineering, this reference shows scientists the tips and techniques of Excel and how to tailor them specifically to their experiments, designs, and research.
 TABLE OF CONTENTS
 When should you use which sampling distribution? We have discussed some general considerations such as using the binomial distribution for proportions. However, most distributions are subject to some extra conditions. The most frequent condition is that a sample and thus the population it is taken from must be normally distributed. And this is not always the case, as you know.
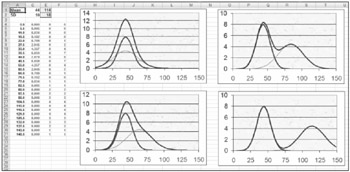
Figure 5.28 shows with a few plots what can go "wrong" with a bell-shaped distribution:
The first curve is actually composed of two subsets which could be a subset of males and a subset of females each of which has its own bell shape. The means of the samples taken from this population would vary equally to either side of the mean of the population that's why the composite curve is still normally distributed.
If the means of the subsets were farther apart, the curve would become bimodal. (A mode is a peak in a curve.) This is the case with the two curves on the right.
IF the SDs of the subsets were different, that would definitely affect the skewness of the curve. The lower-left curve is an example of this situation. In other words, the means of the samples taken from this population would not vary equally to either side of the mean of the population.
For "abnormal" situations like these, you could not use the normal sampling distribution to test the sample distribution for issues such as estimating, significance, and confidence. What alternatives do you have? Figure 5.29 provides an...