Excel 2007 for Scientists and Engineers

With examples from the world of science and engineering, this reference shows scientists the tips and techniques of Excel and how to tailor them specifically to their experiments, designs, and research.
Finding a specific mean in a sample does not imply that other samples taken from the same population will have the same mean nor will the population. Remember the slogan "Results may vary"? In other words, the mean found in the sample stands for a much wider range of means. A scientist must estimate the margins around the mean found in a specific sample. These margins are often called the "margins of error."
Say that in a normally distributed sample, you have measured a mean of 4.15 (pH, oC, ng/ml, mol, or whatever). Now you need to estimate what range of means you should/could expect in other samples taken from that same population. Let's go for 95% of the normal curve, so the mean exp ranges from a minimum value (at 1.96 * SE to the left of mean obs) to a maximum value (at 1.96 * SE to the right of mean obs). The distance to the left and the right of the observed mean is called a confidence limit, confidence margin, or margin of error. Figure 5.30 depicts this scenario for a normal distribution based on a z-test.
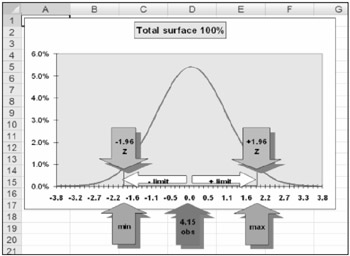
The 95% area under the curve that you usually choose represents the area you want to be covered. So you say that you have 95% confidence that the mean will be found inside the stated range. The area under the curve to the left of the minimum value amounts to 2.5%...