LabVIEW Graphical Programming, Fourth Edition
Written in a highly accessible and readable style, this book illustrates basic LabVIEW programming techniques as well as advanced programming concepts.
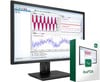
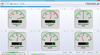
The process control industry calls graphs and charts trend displays. They are further broken down into real-time trends and historical trends, depending on the timeliness of the data displayed. Exactly where the transition occurs, nobody agrees. Typically, a historical trend displays data quite a long time into the past for a process that runs continuously. A real-time trend is updated frequently and only displays a fairly recent time history. Naturally, you can blur this distinction to any degree through crafty programming. Historical trending also implies archival storage of data on disk for later review while real-time trending may not use disk files.
The obvious way to display a real-time trend is to use a Waveform Chart indicator. The first problem you will encounter with chart indicators is that historical data is displayed only if the panel containing the chart is showing at all times. As soon as the panel is closed, the old data is gone. If the chart is updating slowly, it could take quite a long time before the operator sees a reasonable historical record. A solution is to write a program that stores the historical data in arrays and then write the historical data to the chart with the Chart History item in a Property node. You should take advantage of strip charts whenever possible because they are simple and efficient and require no programming on your part.
Consider using an XY Graph as a real-time trend display...