Process Control: A First Course with MATLAB

Written from the perspective of a student, this text emphasizes the importance of computers in the modern age of teaching and practicing process control.
We now use two examples to review how deviation variables relate to the actual ones, and we can go all the way to find the solutions.
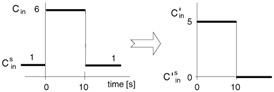
We routinely test the mixing of continuous-flow stirred-Tanks (Fig. 2.6) by dumping some kind of inert tracer, say a dye, into the tank and see how they get "mixed up." In more dreamy moments, you can try the same thing with cream in your coffee. However, you are a highly paid engineer, and you must take a more technical approach. The solution is simple. We can add the tracer in a well-defined "manner," monitor the effluent, and analyze how the concentration changes with time. In chemical reaction engineering, you will see that the whole business is elaborated into the study of residence time distributions.
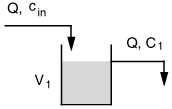
In this example, we have a stirred-Tank with a volume V 1 of 4 m 3 being operated with an inlet flow rate Q of 0.02 m 3/s and that contains an inert species at a concentration C in of 1 gmol/m 3. To test the mixing behavior, we purposely turn the knob that doses in the tracer and we jack up its concentration to 6 gmol/m 3 (without increasing the total flow rate) for a duration of 10 s. The effect is a rectangular pulse input (Fig. 2.7).