Process Control: A First Course with MATLAB

Written from the perspective of a student, this text emphasizes the importance of computers in the modern age of teaching and practicing process control.
The use of block diagrams to illustrate a cause-and-effect relationship is prevalent in control. We use operational blocks to represent transfer functions and lines for unidirectional information transmission. It is a nice way to visualize the interrelationships of various components. They will be crucial in helping us identify manipulated and controlled variables and input(s) and output(s) of a system.
Many control systems are complicated-looking networks of blocks. The simplest control system looks like Fig. 2.11(a). The problem is that many theories in control are based on a simple closed-loop or single-block structure [Fig. 2.11(b)].
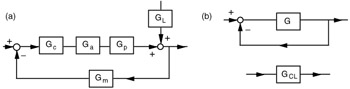
Hence we must learn how to read a block diagram and reduce it to the simplest possible form. We will learn in later chapters how the diagram is related to an actual physical system. First, we do some simple algebraic manipulation and, better yet, do it graphically. It is important to remember that all (graphical) block-diagram reduction is a result of formal algebraic manipulation of transfer functions. When all imagination fails, always refer back to the actual algebraic equations. [23]
Of all manipulations, the most important one is the reduction of a feedback loop. Here is the so-called block-diagram reduction and corresponding algebra.
For a negative-feedback system (Fig. 2.12), we have
| (2.61) | |
| (2.62) | |
Using Eq. (2.61) to substitute for E in Eq. (2.62) leads to
Y = G[ R - HY],
which can...