Numerical Analysis Using MATLAB and Spreadsheets
This concise text provides complete, clear, and detailed explanations of the principal numerical analysis methods and well known functions used in science and engineering.
This chapter is an introduction to regression and procedures for finding the best curve to fit a set of data. We will discuss linear and parabolic regression, and regression with power series approximations. We will illustrate their application with several examples.
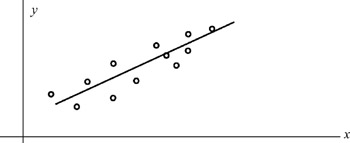
Curve fitting is the process of finding equations to approximate straight lines and curves that best fit given sets of data. For example, for the data of Figure 8.1, we can use the equation of a straight line, that is,
For Figure 8.2, we can use the equation for the quadratic or parabolic curve of the form
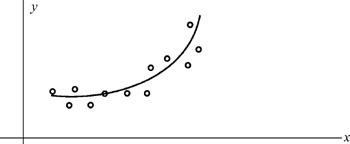
In finding the best line, we normally assume that the data, shown by the small circles in Figures 8.1 and 8.2, represent the independent variable x, and our task is to find the dependent variable y. This process is called regression.
Regression can be linear (straight line) or curved (quadratic, cubic, etc.) and it is not restricted to engineering applications. Investment corporations use regression analysis to compare a portfolio's past performance versus index figures. Financial analysts in large corporations use regression to forecast future costs, and the Census Bureau use it for population forecasting.
Obviously, we can find more than one straight line or curve to fit a set of given data, but we interested in finding the most suitable.
Let the distance of data point x 1 from the line be denoted as