Handbook Of Thermoluminescence

N: Nonlinearity Numerical Curve Fitting Method

Nonlinearity

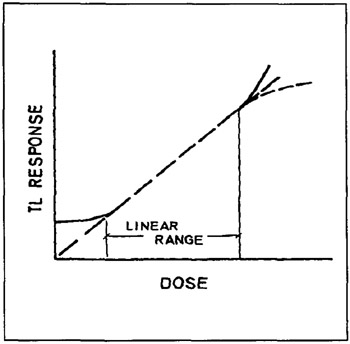
The plot of the TL signal vs. dose may present different zones. A hypothetical curve is shown in Fig.1. As it can be seen from the figure, the TL emission is not linear in the low dose region and is not linear anymore at high doses. To bypass some linguistic ambiguities concerning the terms superlinearity and supralinearity, two universal indices have been proposed by Chen and MacKeever [1] to mathematically describe all forms of nonlinearity.


Fig. 1: The various zones which could be observed in a plot of TL as a function of dose.

The first of these indices is called superlinearity index , g(D); it gives the indication of change in the slope of the dose response in all cases.

The second one is the well known supralinearity index , or dose response function, f(D), used to quantify the size of the correction required for extrapolation of the linear dose region.

As already discussed by Chen and Bowman [2], the term superlinearity is reserved to indicate an increase of the derivative of the M=M(D) function, where M indicates, as usual, the measured TL signal, both the peak height at the maximum or the peak area. Let us indicate by M ? the first derivative of M at a point D and M ? the second derivative. Then, if

M"(D)>0 ?M'(D) increases in D ?M(D) increases and then is superlinear;

if

M"(D)<0 ?M ?(D) decreases in D ?M(D) decreases and then is sublinear;

if

UNLIMITED FREE
ACCESS
TO THE WORLD'S BEST IDEAS

SUBMIT
Already a GlobalSpec user? Log in.

This is embarrasing...

An error occurred while processing the form. Please try again in a few minutes.

Customize Your GlobalSpec Experience

Category: IC Electronic Filters
Finish!
Privacy Policy

This is embarrasing...

An error occurred while processing the form. Please try again in a few minutes.