Gas Well Testing Handbook

Offering a thorough understanding of gas well test analysis basics, this book focuses on practical field application, where over 100 field examples are presented to illustrate basic methods for analysis.
 TABLE OF CONTENTS
 The pressure derivative application to gas well test analysis involves the combined use of existing type curves in both the conventional dimensionless pressure form ( P D) and the new dimensio`nless pressure derivative grouping  . Thus this new approach has combined the most powerful aspects of the two previously distinct methods into a single-stage interpretive plot. Use of the pressure derivative with pressure-behavior type curves reduces the uniqueness problem in type curve matching and gives greater confidence in the results. Features that are hardly visible on the Horner plot or are hard to distinguish because of similarities between are reservoir system and another are easier to recognize on the pressure-derivative plot.
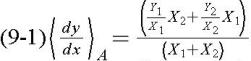
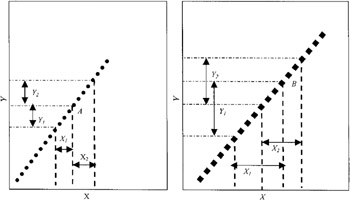
Figure 9 1 illustrates the calculation of the derivative at a given point A given by the following relationship:
Derivative response patterns for the flow regimes are shown in Figures 9 2 through 9 6. For each flow there is a specified plot of the portion of the data exhibiting the characteristic derivative response pattern. On the specialized plot, the data identified with the characteristic derivative response pattern lie on a straight line, and the slope and the intercepts of the line are used to compute well and/or reservoir parameters. Figures 9 2 through 9 6 show the specialized plot associated with respective trends identified on the log-log diagnostic plot of pressure change and its derivative.



