Gas Well Testing Handbook
Offering a thorough understanding of gas well test analysis basics, this book focuses on practical field application, where over 100 field examples are presented to illustrate basic methods for analysis.
 TABLE OF CONTENTS
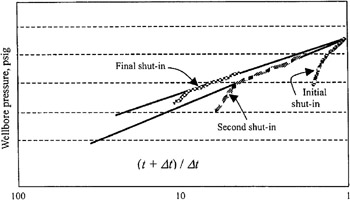
 The normal Horner and/or Miller, Dyes, and Hutchinson methods are applicable to drill-stem tests. At times, shortcut methods as used by service companies in field analysis are reliable. The drill-stem test often uses two bombs, and one or more flow and shut-in sequences are recorded, as illustrated in Figures C 1 and C 2. To illustrate how a typical DST is performed, we will examine a schematic chart (Figure C 1) of pressure versus time from a test with two flow periods and two shut-in periods.
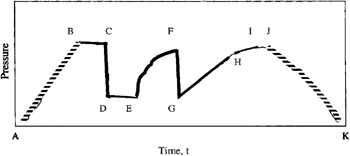
Point A: Tool is lowered into the hole.
Point B: Tool is on bottom.
Point C: Packers are set, the mud column is compressed, and a still higher pressure is recorded.
Point D: Tool is opened for an initial flow period and the pressure drop as shown.
Point E to point F: Fluid accumulates in the drill stem above the pressure gauge, the well is shut in, and pressure rises to point F.
Point G to point H: After a suitable shut-in period, the well is reopened for a second final flow period from point G to point H.
Point H to point I: Final shut-in period.
Point J to point K: Packers are then released; the testing device is then removed from the hole.
The first flow is very short and is designed to remove any...