Gas Well Testing Handbook

Offering a thorough understanding of gas well test analysis basics, this book focuses on practical field application, where over 100 field examples are presented to illustrate basic methods for analysis.
 TABLE OF CONTENTS
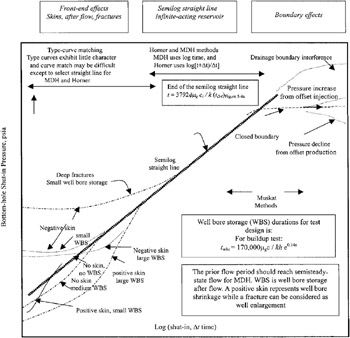
 Figure 6 2 shows pressure buildup curve shapes. As also shown in that figure, the fracture cases and large negative skin cases approach the semilog straight line from above when wellbore storage is small. That figure also shows that behavior can be hidden by large wellbore storage effects, so the buildup curve may have the characteristic shape associated with wellbore storage or with a positive skin. For the figure shown Miller, Dyes, and Hutchinson scales2 are used. The Horner plot is equally useful and is often preferred. Details discussion can be found in the next sections.