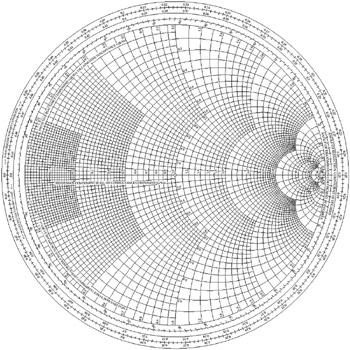
Electromagnetics for High-Speed Analog and Digital Communication Circuits

The Smith Chart, shown in Fig. 9.31, is simply a graphical calculator for computing impedance as a function of reflection coefficient z = f( ?). More importantly, many problems can be easily visualized with the Smith Chart. This visualization leads to an insight about the behavior of transmission lines. All the knowledge is coherently and compactly represented by the Smith Chart. Why else study the Smith Chart? It s beautiful and extremely insightful! There are deep mathematical connections in the Smith Chart. The study of the complex bilinear transform sheds much insight into the geometry of the Smith Chart.
Let s begin with the voltage on the line
Recall that we can define the reflection coefficient anywhere by taking the ratio of the reflected wave to the forward wave
Therefore the impedance on the line
can be expressed in terms of ?( z )
It is extremely fruitful to work with normalized impedance values z = Z/ Z 0
Let the normalized impedance be written as z = r + jx (note small case). The reflection coefficient is normalized by default since for passive loads ? ? 1. Let ? = u + j v. Now simply equate the
and
components in the above equation
To obtain the relationship between the ( r, x) plane and the ( u, v) plane
The above...