Understanding Synthetic Aperture Radar Images
By helping you to quickly assess which components of an SAR image should be measured, this book enables you to devote more time and energy to the real task of image interpretation and analysis.
In the previous chapter we demonstrated how the information contained in textured clutter could be exploited for both classification and segmentation. However, it is clear from studying SAR images, such as the rain forest example in Figure 8.1, that texture information is not only contained in the single-point statistics but also in the correlation (and spectral) properties. This chapter provides the background for incorporating correlation properties into techniques for extracting information from texture. We shall assume, as in Chapter 8, that the RCS can be regarded as a single realization of a stationary gamma-distributed noise process. The discussion will be centered on the set of simulated correlated textures illustrated in Figure 9.1. These correspond to single-look SAR intensity images of a gamma-distributed RCS with a symmetrical Gaussian ACF of the form
| (9.1) |  |
where X and Y are the lags in each dimension, v the order parameter and ? the correlation length. In Figure 9.1 v takes values of 0.5, 1.0, and 2.0 while ? corresponds to 1, 2, 4, and 8 pixels. These textures can be simulated exactly since they have half-integer order parameters and thus obey the random walk model of Section 5.8. For this simulation the imaging process did not introduce any further correlations. Real data would have to be resampled to match this behavior by removing PSF correlations, as described in Chapter 4.
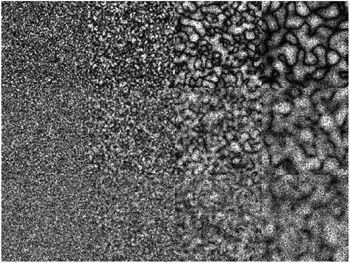
The textures, characterized by ( v, ?) are labeled from 1 to 12 and...