Understanding Synthetic Aperture Radar Images

By helping you to quickly assess which components of an SAR image should be measured, this book enables you to devote more time and energy to the real task of image interpretation and analysis.
 TABLE OF CONTENTS
 The properties of a homogenous region in a SAR image that is made up of independent normally distributed pixels are completely described if we can provide an accurate estimate of the covariance matrix. For single-channel data this is straightforward, since the in-phase and quadrature channels are uncorrected Gaussian variables with the same variance ?/2. Hence, only ? need be estimated, and it is easy to show that, given N observations of spatially uncorrelated data, the MLE of ? is given by multilooking, as discussed in Section 4.4.
For Gaussian polarimetric data the MLE of the covariance matrix C is similarly shown to be [35]
| (11.44) | 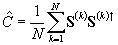 |
where S ( k ) denotes the kth complex data vector. In other words, the sample covariance matrix is the MLE of the true covariance matrix. In the case of two channels, the covariance matrix has the form
| (11.45) |  |
so the MLE estimates are the multilook averages
| (11.46a) | 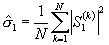 |
| (11.46b) | 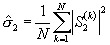 |
and
| (11.46c) | 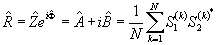 |
The joint PDF of the estimates has the form of a complex Wishart distribution [35] given by
| (11.47) | 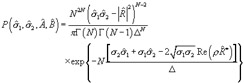 |
where ? = ? 1 ? 2(1 - ? 2) and  . The marginal distributions of
  and
and  are gamma distributions identical to the multilook distribution (4.9) and need no further discussion. The specific polarimetric parameters are conveyed by
  , the PDF of whose amplitude and phase is found by integrating
  and
and  out of (11.47)...