Understanding Synthetic Aperture Radar Images

By helping you to quickly assess which components of an SAR image should be measured, this book enables you to devote more time and energy to the real task of image interpretation and analysis.
In Appendix 11A we establish that a number fluctuation model leads to a description of the scattering matrix data as
| (11.61) | |
where T is a positive real texture variable and G is a multivariate Gaussian variable independent of T. The properties of the Gaussian component, G, can be estimated from the data since ![]() (see (11.8)). Hence S and G have the same covariance matrix. Also, since S i/ S j = G i/ G j is independent of T, the single-look amplitude ratio and phase difference distributions are exactly the same as for the Gaussian case. Tests confirming this have been reported [14]. The Hermitian product
(see (11.8)). Hence S and G have the same covariance matrix. Also, since S i/ S j = G i/ G j is independent of T, the single-look amplitude ratio and phase difference distributions are exactly the same as for the Gaussian case. Tests confirming this have been reported [14]. The Hermitian product ![]() will, however, show evidence for the departure from Gaussian behavior either through its real and imaginary parts or through its amplitude (though not through its phase, since this is the phase difference distribution discussed in Section 11.6.1); the corresponding analysis in given in [44].
will, however, show evidence for the departure from Gaussian behavior either through its real and imaginary parts or through its amplitude (though not through its phase, since this is the phase difference distribution discussed in Section 11.6.1); the corresponding analysis in given in [44].
For the particular case of negative binomial number fluctuations, T 2 is gamma-distributed with mean 1; hence, T has a square-root gamma distribution given by
| (11.62) | |
where v is an order parameter. In this case we can derive the PDF of the scattering matrix data for the M-dimensional product model as
| (11.63) | 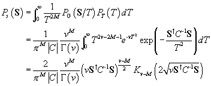 |
This is a multidimensional K distribution. In similar fashion, any of the other PDFs arising from the product model can be derived by integrating over T