Oil Well Testing Handbook

Providing real-life examples and cases, this resource contains the basics of well testing methods as well as all of the latest developments in the field, including testing for horizontal wells.
 TABLE OF CONTENTS
 Instead of a single straight line for all times, we obtain a curve with a complicated shape, which indicates the effect of afterflow, we can logically divide a buildup curve into three regions (see Figure 5-2):
Early-time region (ETR). In this region, a pressure transient is moving through the formation nearest the wellbore.
Middle-time region (MTR). In this region, the pressure transient has moved away from the wellbore into the bulk formation.
Late-time region (LTR). In this region, the pressure transient has reached the drainage boundaries well.
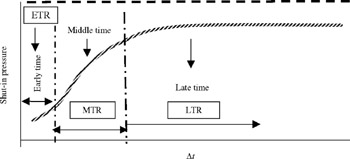
MTR is a straight line. This is the portion of the buildup curve that we must identify and analyze. Analysis of this portion only will provide reliable reservoir properties of the tested well. The reasons for the distortion of the straight line in the ETR and LTR are as follow: In the ETR, the curve is affected by:
Altered permeability near the wellbore;
Wellbore storage.
Using a packer in the hole and shutting-in the well at the packer can minimize this effect. In the LTR, the pressure behavior is influenced by boundary configuration, interferences from nearby wells, reservoir heterogeneities, and fluid/fluid contacts.
Analyzing a pressure buildup in an infinite-acting reservoir using Horner's technique involves the following steps:
Find t p, the cumulative production since completion divided by the rate, immediately before shut-in (when rate varies). As a matter of general practice to approximate, t