Oil Well Testing Handbook

Providing real-life examples and cases, this resource contains the basics of well testing methods as well as all of the latest developments in the field, including testing for horizontal wells.
The pressure buildup behavior is described by
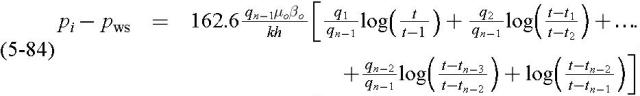
where t t n?1 = ?t, time after shut-in and q n?1 is the production rate just before shut-in. Eq. 5-84 is based on the fact that for t = t p1 + t P2 + +t pn?1 + (t ?t n?1) the reservoir is infinite-acting. The following analysis
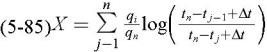
procedure can be used. Plot p ws versus on ordinary (Cartesian coordinate) graph paper, where plotting function is
Determine the slope m of the plot and calculate the formation permeability by the equation
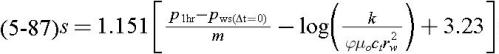
Calculate the skin factor s from the equation
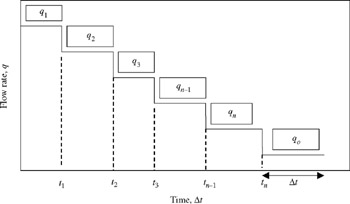
The original reservoir pressure p i is the value of p ws on the MTR line extrapolated to = 0. Figure 5-22 shows the schematic representation of rate variation preceding a pressure buildup test.
A variable-rate flow test was run on a well with the given properties. From these properties and the data in Tables 5-11 and 5-12, determine k, s,
( ?p) skin, p *, and flow efficiency. Well and reservoir data: depth = 5250 ft; average pressure = 3000 psi; ? 0 = 0.80 cP; ? 0 = 1.136 rb/stb; h = 11 ft; ? = 0.12; c t