Oil Well Testing Handbook

Providing real-life examples and cases, this resource contains the basics of well testing methods as well as all of the latest developments in the field, including testing for horizontal wells.
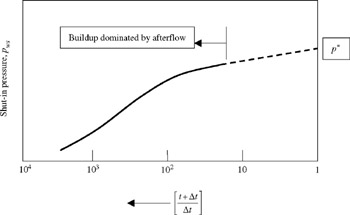
Russell [2] presented a theoretical method for analyzing the pressure response during the afterflow period in order to determine kh and s. In some cases, however, afterflow analysis provides a valuable means of obtaining information about the reservoir. For instance, in several areas in the Middle East, wells are capable of producing in excess of 50,000 mbbl from limestone reservoirs. Because of very high kh values, which lead to very rapid pressure buildups, and the fact that in many cases the wells produce through casing, the afterflow period can completely dominate the pressure buildup and afterflow analysis is the only method of determining the essential reservoir parameters. Figure 5-19 shows the pressure buildup dominated by afterflow which distorts the early part of the Horner buildup plot.
McKinly, [18], [21] Ramey and Cobb, [12] and Earlougher and Kersch [19] have also presented afterflow analysis technique relying on the use of type curves. Of all these methods, which is the most reliable is a question that is still unanswered. Afterflow analysis by type curves matching techniques as discussed in Chapter 7. The analysis method that will be described in this section is of Russell. [2] He developed a theoretical equation describing how the bottom-hole pressure should increase as fluid accumulates in the well-bore during the buildup. As a result of this, he determined that the correct way of plotting the pressure during...