Planning Using Primavera SureTrak Project Manager Version 3.0 Revised 2006
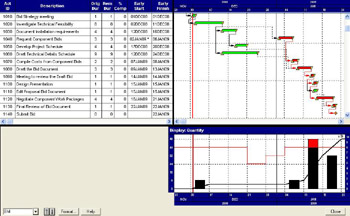
Resource Histograms and S-Curves display the resource requirements in the lower portion of the screen in graphical or tabular format. These functions will not be covered in detail in this chapter but experimenting with the options will reveal how they work.
The resource requirements for the project and consumption to date,
Identify where there are insufficient resources and
Display cash flow information.
These are titled Profiles and may be displayed in the lower half of the screen by selecting View, Resource Profile or Ctrl F7.

Right click with the mouse over the histogram to see cumulative quantities or costs, and left click over the histogram to see periodic quantities or costs.
Select one or resources from the drop down box in the bottom left hand side by Ctl and left clicking.
Click on
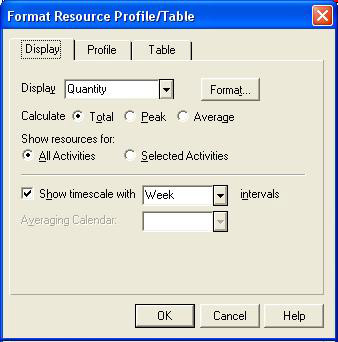
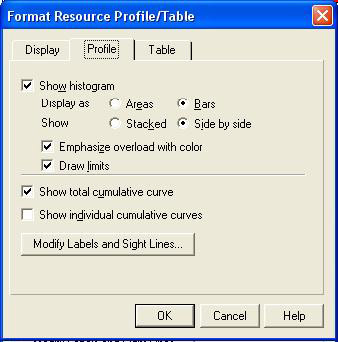
to open the Format Resource Profile/Table form and set the Display and Display options.


The Resource Table may be displayed by selecting View, Resource Table or Shift F7.

Select one or resources from the drop down box in the bottom left hand side by Ctl and left clicking.
Click on
is used in the same way as in the Resource Histogram.
Select View, Resource Legend to display the Resource Legend on the screen.
The Format Resource Profile/Table form Table option allows the column and row totals to be displayed or hidden.