Planning Using Primavera Project Planner P3 Version 3.1 Revised 2006
Chapter 20: Resource Histogrammes & Tables

20.1 Resource Histogram

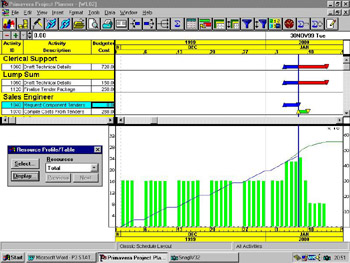
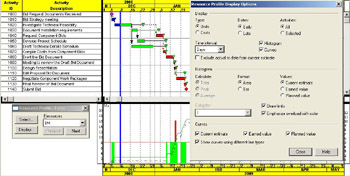
Histograms and S-Curves are not covered in detail. They may be displayed by selecting View, Resource Profile or Ctrl F7.

  • Select allows you to select which resources are drawn. Resources may be grouped for analytical purposes. Use the Ctrl key to select more than one resource.

  • Right or left click with the mouse over the histogram to see cumulative or period quantities or costs.

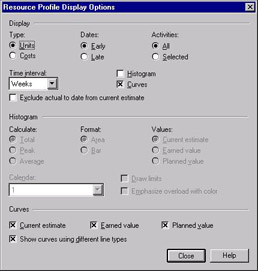
  • Display is used to decide how the information is displayed.

20.2 Resource Table

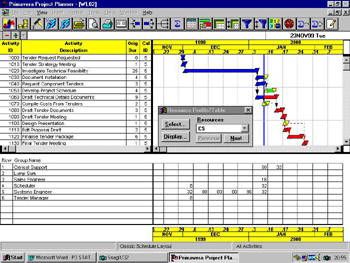
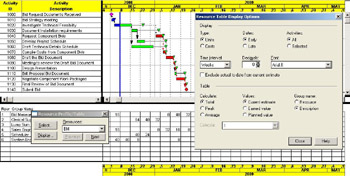
Resource Tables are not covered in detail in this book. They may be displayed by selecting View, Resource Profile or Shift F7.

Select and Display are used in the same way as in the Resource Histogram.

20.3 Printing Histograms & Tables

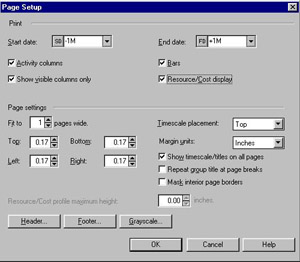
Be sure you check the Resource Cost display in the Page Setup form when you wish to print a Histogram or Table.

Workshop 23: Resource Histograms and Tables

Create the following in the lower pane:

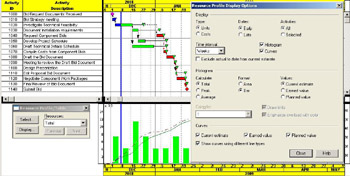
  1. A Resource Histogram by Day for the Bid Manager, it can be seen that the Bid Manager is overloaded for one day:

  2. A Resource Histogram by week for all combined resources

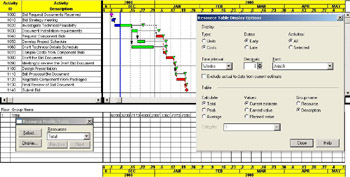
  3. A resource Table as per below:

  4. A cash flow by week

UNLIMITED FREE
ACCESS
TO THE WORLD'S BEST IDEAS

SUBMIT
Already a GlobalSpec user? Log in.

This is embarrasing...

An error occurred while processing the form. Please try again in a few minutes.

Customize Your GlobalSpec Experience

Category: Enterprise Manufacturing Intelligence Software (EMI)
Finish!
Privacy Policy

This is embarrasing...

An error occurred while processing the form. Please try again in a few minutes.